英语图表作文题目?2022年考研英语(二)大作文题目为饼状图,主题为某高校学生旅游目的调查,核心数据包括:欣赏美景(37%)、缓解压力(33%)、结交新朋友(9%)、培养独立能力(6%)。那么,英语图表作文题目?一起来了解一下吧。
英语二大作文模板一、图表作文模板
英语二大作文图表类型包括曲线图(graph)、柱状图(bar chart)、饼状图(pie chart)和表格(table),文章通常分三段展开。
第一段:数据描述段
曲线图、柱状图
The bar chart/graph reflects the changes in/percentages of/information about 描述对象 between 时间1 and 时间2. It is noticeable that 项目1 increase/decrease considerably/slightly from 起点数字 in 时间 to 终点数字 in 时间. Meanwhile, 项目2 is on a constant rise/decline from 起点数字 to 终点数字 over the same period.
示例:The bar chart reflects the changes in the sales volumes of two brands of mobile phones between 2018 and 2022. It is noticeable that the sales volume of Brand A increases considerably from 1 million in 2018 to 3 million in 2022. Meanwhile, the sales volume of Brand B is on a constant decline from 2 million to 0.8 million over the same period.
饼状图
The pie chart reflects the percentages of/information about 描述对象 in 时间. At 百分比1% we can see that 项目1 accounts for the majority. 百分比2% goes to 项目2, as the second largest portion. Next come 项目3, 项目4 and 项目5, which constitute 百分比3%, 百分比4% and 百分比5% respectively.
示例:The pie chart reflects the percentages of students' favorite sports in a school in 2023. At 40% we can see that basketball accounts for the majority. 30% goes to football, as the second largest portion. Next come tennis, swimming and volleyball, which constitute 15%, 10% and 5% respectively.
表格
The table gives information about 描述对象 in 地点 in 时间. At 百分比1% we can see that the vast majority of 人物1做某事, while the largest proportion of 人物2做某事, representing 百分比2%. In contrast, as much as 百分比3% of 人物3做某事, taking up the largest share.
示例:The table gives information about the employment preferences of graduates in a university in Beijing in 2023. At 50% we can see that the vast majority of science graduates choose to work in high-tech companies, while the largest proportion of arts graduates choose to work in cultural industries, representing 40%. In contrast, as much as 60% of business graduates choose to start their own businesses, taking up the largest share.
第二段:原因分析段
曲线图、柱状图、表格
There are several reasons why the chart given in question reveals such a development. The most convincing reason for this might lie in the fact that 原因1. As a result, 推论1. Another important factor that deserves some words here is that 原因2. Therefore, 推论2. The last possible reason is that 原因3. So, 推论3.
示例:There are several reasons why the chart given in question reveals such a development. The most convincing reason for this might lie in the fact that the improvement of product quality. As a result, the sales volume of Brand A increased significantly. Another important factor that deserves some words here is that the poor marketing strategy of Brand B. Therefore, its sales volume declined. The last possible reason is that the change in consumer preferences. So, more consumers chose Brand A.
饼状图
According to the available information, it is crystal clear that 阐述最大饼块. This suggests that 展开说明. Interestingly, 阐述最小饼块(other除外), which indicates that 展开说明.
示例:According to the available information, it is crystal clear that basketball is the most popular sport among students. This suggests that basketball has a strong appeal to young people. Interestingly, volleyball is the least popular sport, which indicates that it may need more promotion and improvement to attract more students.
第三段:评论段
做预测
In summary, the favorable trend is predicted to continue over the next year. We have enough reasons to believe that an increasing number of 描述对象 will 做某事.
示例:In summary, the favorable trend of the increasing sales volume of Brand A is predicted to continue over the next year. We have enough reasons to believe that an increasing number of consumers will choose Brand A.
写利弊
To sum up, this development has both advantages and disadvantages. The benefit is that 好处, but at the same time, it poses a challenge that 坏处.
示例:To sum up, the increasing popularity of online shopping has both advantages and disadvantages. The benefit is that it provides consumers with more convenience and choices, but at the same time, it poses a challenge that it may lead to the decline of traditional physical stores.
提建议
Overall, in spite of some benefits we can reap from this development, I personally suggest that 建议.
示例:Overall, in spite of some benefits we can reap from the development of urbanization, I personally suggest that the government should pay more attention to environmental protection and improve the living conditions of rural migrants.
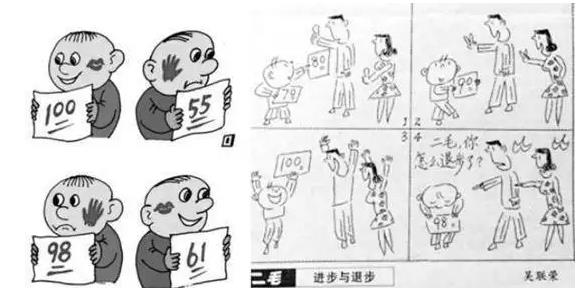
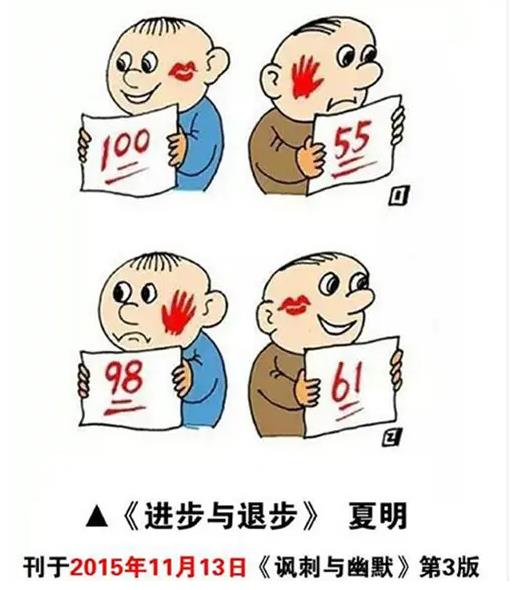
二、图画作文模板第一段:描述图片
As we can see from the picture, 描述图片内容. Under the picture there is/are an/some eye-catching word/words reading: 图下词语. I have seen lots of comments about 主旨词 on the weibo and wechat, the most influential social network, these days. There is no denying the fact that 主旨词 has stimulated a heated discussion.
示例:As we can see from the picture, a man is sitting in front of a computer, looking tired and stressed. Under the picture there is an eye-catching word reading: "Overwork". I have seen lots of comments about overwork on the weibo and wechat, the most influential social network, these days. There is no denying the fact that overwork has stimulated a heated discussion.
第二段:解释说明
Simple as the picture is, the author intends to convey more complicated and profound meaning than what we may sense at first glance. Therefore, the cartoon does demonstrate that 主题句. For example, the success of Ma Yun, founder of China’s online trading empire Alibaba and Taobao, clearly/distinctly illustrates/proves the importance of 主旨词 in realizing personal ambition and creating value for the society.
示例:Simple as the picture is, the author intends to convey more complicated and profound meaning than what we may sense at first glance. Therefore, the cartoon does demonstrate that overwork is harmful to people's health. For example, the success of Ma Yun, founder of China’s online trading empire Alibaba and Taobao, clearly illustrates the importance of a healthy work-life balance in realizing personal ambition and creating value for the society.
第三段:评论
结尾一
It is not a difficult job for us to make clear the meaning of the cartoon and come up with some comments that refer to the above phenomenon. 做出评论并用if条件状语虚拟升华。
以下是整理后的大学英语四级作文模板,涵盖图表写作、书信模板(求职信、拒绝信)、不同观点列举型作文及常用过渡句与总结句,适用于四级考试各类写作题型:
一、图表写作模板适用场景:描述图表数据变化(如柱状图、折线图、饼图等)。结构:现象描述→原因分析→个人观点/总结。
首段(现象描述):As is shown in the chart/graph/diagram/table above, 主题(如“the number of internet users”) has changed drastically in the past 时间(如“decade”). While 过去数据(如“it accounted for only 10% in 2010”), now the percentage of 当前数据(如“mobile users has risen to 75%”). Meanwhile, the number of 相关数据(如“PC users has declined to 25%”).
第二段(原因分析):There are mainly two possible reasons contributing to the rapid changes. The first is that 原因一(如“the widespread adoption of smartphones”). Secondly, 原因二(如“the convenience of mobile internet access”).
第三段(个人观点/总结):In my point of view, the changes have a great influence on 影响对象(如“people’s daily lives”). At the same time, 补充影响(如“they also pose challenges to traditional industries”). To sum up, 总结句(如“the trend is irreversible and we should adapt to it”).
二、书信模板1. 求职信模板适用场景:申请职位或实习。
英语二大作文模板(图表类)第一段:描述图表
The chart given above provides information clearly about the theme of ______(主题,如“the changes in online shopping habits”).
To be specific, the proportion of 主体1(如“urban residents”) increased slightly from 67.77% to 71.93% during the first three years.
By contrast, the number of those with 主体2(如“rural residents”) climbed dramatically from 71.93% to 88.24% in the final year.
Isolated as the figures seem to be, as a matter of fact, they are connected to one another.
(注:根据图表类型调整描述方式)
Line chart(曲线图): 强调趋势变化(如“The line chart illustrates the fluctuation of...”)。
25考研英语二可参考以下3套作文模板,涵盖图表作文等常见题型,使用时需结合自身理解调整优化:
模板1:图表作文模板使用说明:图表作文中间段和末段结构固定,首段需区分静态图(如饼图、表格)和动态图(如柱状图、折线图)的数据描述方式。
首段:数据描述
动态图:As is vividly revealed in the bar chart, some remarkable changes have taken place in [主题词] with regard to [变量类别]. In the year of [起始年份], the number of [变量①] was [起始量], while it went progressively down to [终点量] [时间跨度] later. In the meantime, however, the [变量②] has experienced a dramatic increase, reaching [终点量] in [截止年份].示例:若描述2010-2020年城市与农村人口变化,可填入“urban population”和“rural population”作为变量①和②,并补充具体数据。

以下是一个英语二大作文万能模板,采用三段式结构,涵盖数据特征描述、原因与影响分析、趋势预测与建议,适用于大多数图表类作文题目:
第一段:数据特征描述
点题句:The chart/graph/table clearly illustrates the changes/trends in [主题,如“mobile payment usage”] over the period from [起始年份] to [结束年份]/among [不同群体,如“urban and rural residents”].
有时间变化的图(如折线图、柱状图):
As can be seen from the chart, the proportion/number of [主题相关对象,如“online shoppers”] increased dramatically from [具体数值] in [年份] to [具体数值] in [年份], while [另一相关对象,如“traditional shoppers”] declined steadily during the same period.
Alternatively: The data reveals a sharp rise in [主题指标,如“carbon emissions”] from [数值] to [数值] over the decade, reaching a peak of [峰值数值] in [年份].
无时间变化的图(如饼图):
The pie chart presents a clear distribution of [主题,如“energy consumption sources”], with [最大占比部分,如“coal”] accounting for [百分比], followed by [次大部分,如“natural gas”] at [百分比], and [最小部分,如“renewables”] making up the remaining [百分比].
Alternatively: The graph highlights the significant dominance of [主导部分,如“smartphones”] in the market, constituting [百分比] of total sales, whereas [其他部分,如“feature phones”] only occupy a marginal share of [百分比].
第二段:原因与影响分析
原因分析:
The observed changes can be attributed to several key factors. Firstly, economic factors play a crucial role, as rising disposable incomes and improved living standards have enabled more people to afford [相关产品/服务,如“international travel”].
Secondly, technological advancements have revolutionized the way we [相关行为,如“communicate”], with the widespread adoption of [技术工具,如“5G networks”] making [相关活动,如“video calls”] more accessible and convenient.
Additionally, social and cultural shifts have also contributed, such as the growing emphasis on [社会价值观,如“environmental protection”], which has spurred demand for [环保相关产品/服务,如“electric vehicles”].
影响分析:
These changes have both positive and negative implications. On the positive side, they have boosted economic growth by creating new industries and job opportunities in sectors like [相关行业,如“e-commerce”].
However, they also pose challenges, such as environmental degradation, as increased [活动,如“industrial production”] leads to higher pollution levels and resource depletion.
第三段:趋势预测与建议
趋势预测:
Looking ahead, it is likely that this trend will continue in the coming years. With ongoing technological innovation and policy support, the popularity of [主题相关对象,如“renewable energy”] is expected to surge further, potentially accounting for [预测百分比] of the total energy mix by [年份].
Alternatively: However, if no effective measures are taken, the negative impacts, such as [具体问题,如“traffic congestion”], may worsen, posing a threat to sustainable development.
建议句:
To ensure a balanced and sustainable future, it is essential to [建议措施,如“promote public transportation”] and [另一建议,如“encourage green consumption”].
Additionally, governments and businesses should collaborate to [长期解决方案,如“invest in research and development of clean technologies”], thereby mitigating potential risks and maximizing the benefits of these changes.
使用说明:
根据题目要求替换方括号内的内容,确保主题与图表一致。

以上就是英语图表作文题目的全部内容,以下是一个英语二大作文万能模板,采用三段式结构,涵盖数据特征描述、原因与影响分析、趋势预测与建议,适用于大多数图表类作文题目:第一段:数据特征描述 点题句:The chart/graph/table clearly illustrates the changes/trends in [主题,内容来源于互联网,信息真伪需自行辨别。如有侵权请联系删除。